


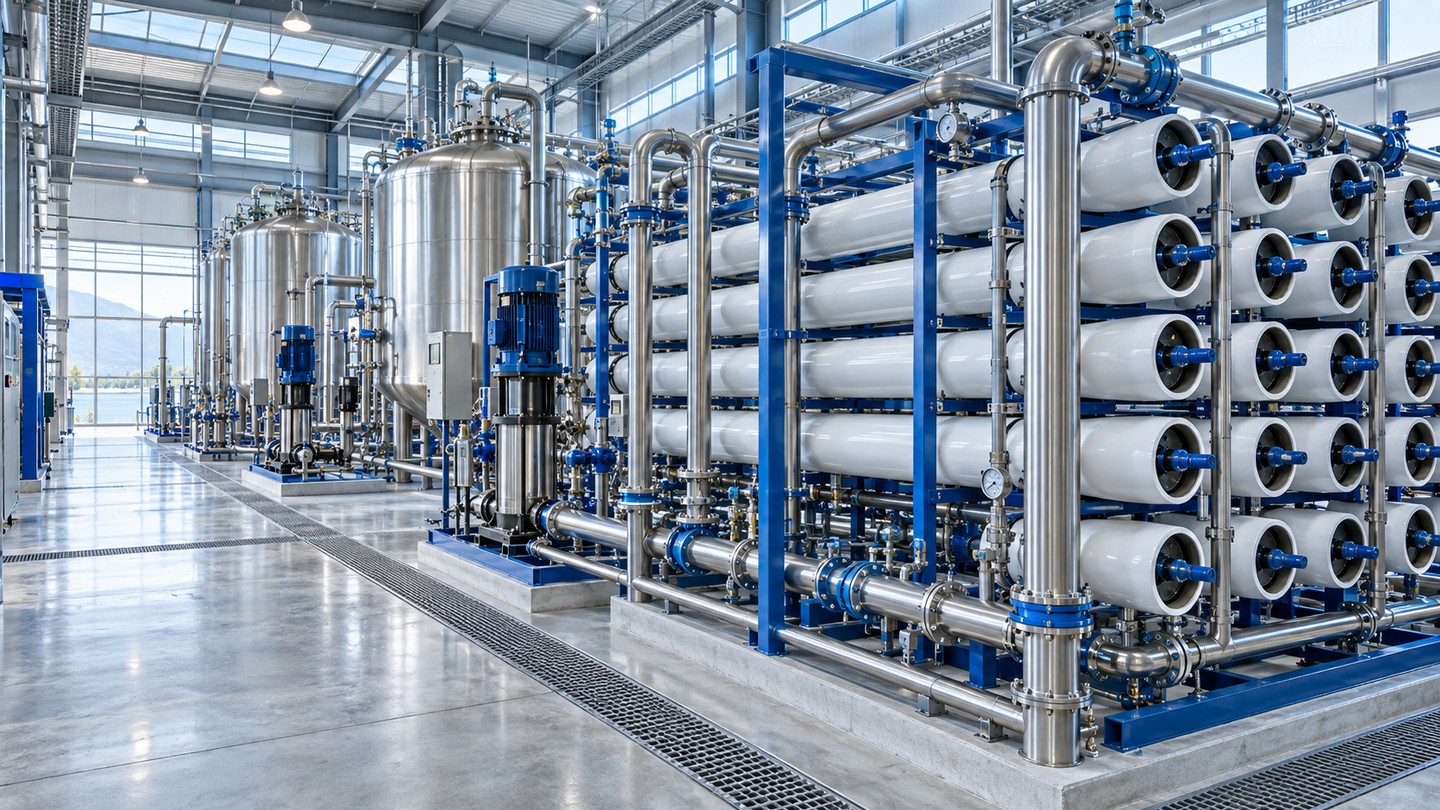
In industry, water is a raw material and a full utility: it cools, transports, cleans, goes into products, and becomes steam. But behind the word "water" hide very different qualities, from cooling water to laboratory ultrapure water.
How much does industry really consume in Belgium and France? Which sectors weigh the most? And above all, what type of water for which use? Here is the overview, with figures and solutions.
1. How much does industry consume? The French case
In 2023, France withdrew about 29.4 billion m³ of freshwater (excluding hydroelectricity). The breakdown by use is telling:
| Use | Share of withdrawals (FR, 2023) |
|---|---|
| Power-plant cooling | ≈ 45% |
| Feeding navigation canals | ≈ 20% |
| Drinking-water production | ≈ 18% |
| Agriculture (irrigation) | ≈ 10% |
| Other economic activities (industry) | ≈ 7% |
Two takeaways: cooling (mostly of power plants) is by far the top item, and non-energy industry weighs a more modest but very quality-sensitive share. Another striking fact: since the mid-2000s, industrial withdrawals have dropped by about 33%, driven by efficiency and water recycling.
2. And in Belgium?
Belgium follows the same logic. In Wallonia, the energy sector (thermal-plant cooling) alone accounts for about 67% of withdrawn volumes (2016-2020 average), ahead of drinking-water production (≈ 22%) and industry proper (≈ 10%).
Here too, industrial consumption is falling sharply: Walloon industry withdrawals have dropped by about 60% in ten years, driven by the restructuring of the steel industry and above all by many investments in closed-loop water circuits and process optimisation. The underlying trend is clear: consume less, recycle more.
3. Global water consumption: a different logic
These European figures take on full meaning compared to the global level. The planet withdraws about 4,000 billion m³ of freshwater per year, but the breakdown is very different from ours:
| Use | Global share | Share in France |
|---|---|---|
| Agriculture (irrigation) | ≈ 70% | ≈ 10% |
| Industry (incl. energy / cooling) | ≈ 15 to 20% | ≈ 52%* |
| Domestic / municipal uses | ≈ 12 to 13% | ≈ 18% |
* Power-plant cooling (≈ 45%) + industry (≈ 7%), excluding navigation canals (≈ 20%).
The contrast is stark: globally, agriculture dwarfs everything, whereas in France and Belgium, cooling and industry dominate, with agriculture weighing much less. As a rule, industrialised countries devote a much higher share of their water to industry and energy, while low-income countries allocate it mainly to agriculture. A country's water consumption therefore also tells its economic model.
4. The world's biggest water consumers
Ranked by total freshwater withdrawn per year, a few giants dominate, driven by population size and by agriculture. Here are the top 15 countries (World Bank / FAO AQUASTAT data, 2020), followed by France and Belgium, lower in the global ranking.
| Rank | Country | Withdrawals (km³/yr) | Dominant use |
|---|---|---|---|
| 1 | India | ≈ 647 | Agriculture (≈ 90%) |
| 2 | China | ≈ 568 | Agriculture (≈ 62%) |
| 3 | United States | ≈ 444 | Industry / energy (≈ 47%) |
| 4 | Indonesia | ≈ 223 | Agriculture (≈ 85%) |
| 5 | Pakistan | ≈ 190 | Agriculture (≈ 94%) |
| 6 | Iran | ≈ 93 | Agriculture (≈ 92%) |
| 7 | Mexico | ≈ 90 | Agriculture (≈ 76%) |
| 8 | Philippines | ≈ 86 | Agriculture (≈ 79%) |
| 9 | Vietnam | ≈ 82 | Agriculture (≈ 95%) |
| 10 | Japan | ≈ 78 | Agriculture (≈ 68%) |
| 11 | Egypt | ≈ 78 | Agriculture (≈ 79%) |
| 12 | Brazil | ≈ 67 | Agriculture (≈ 62%) |
| 13 | Russia | ≈ 65 | Industry / energy (≈ 45%) |
| 14 | Turkey | ≈ 62 | Agriculture (≈ 87%) |
| 15 | Uzbekistan | ≈ 59 | Agriculture (≈ 92%) |
| · · · intermediate ranks · · · | |||
| ≈ 29 | France | ≈ 26 | Industry / energy (≈ 68%) |
| ≈ 67 | Belgium | ≈ 4.2 | Industry / energy (≈ 81%) |
Two takeaways. First, the top of the ranking is held by very populous, very agricultural countries (India, China, Pakistan, Indonesia, Vietnam): irrigation explains most of the volumes there. Second, France (≈ 29th) and Belgium (≈ 67th) withdraw modest volumes globally, but with one of the highest industry / energy shares, reflecting industrialised economies where agriculture consumes relatively little.
5. The major consuming sectors
Beyond energy, industrial water uses concentrate in a few sectors:
| Sector | Main water use |
|---|---|
| Energy (power plants) | Cooling (item no. 1) |
| Chemicals / petrochemicals | Cooling, processes, steam |
| Food & beverage | Ingredient, processes, cleaning (CIP) |
| Paper / board | Processes (very large volumes) |
| Steel / metallurgy | Cooling, pickling, rinsing |
| Microelectronics / pharma | Ultrapure water |
| Textiles | Dyeing, washing |
Each of these uses requires different water: a cooling tower and a pharma line have nothing in common in terms of quality.
6. Each use, its type of water
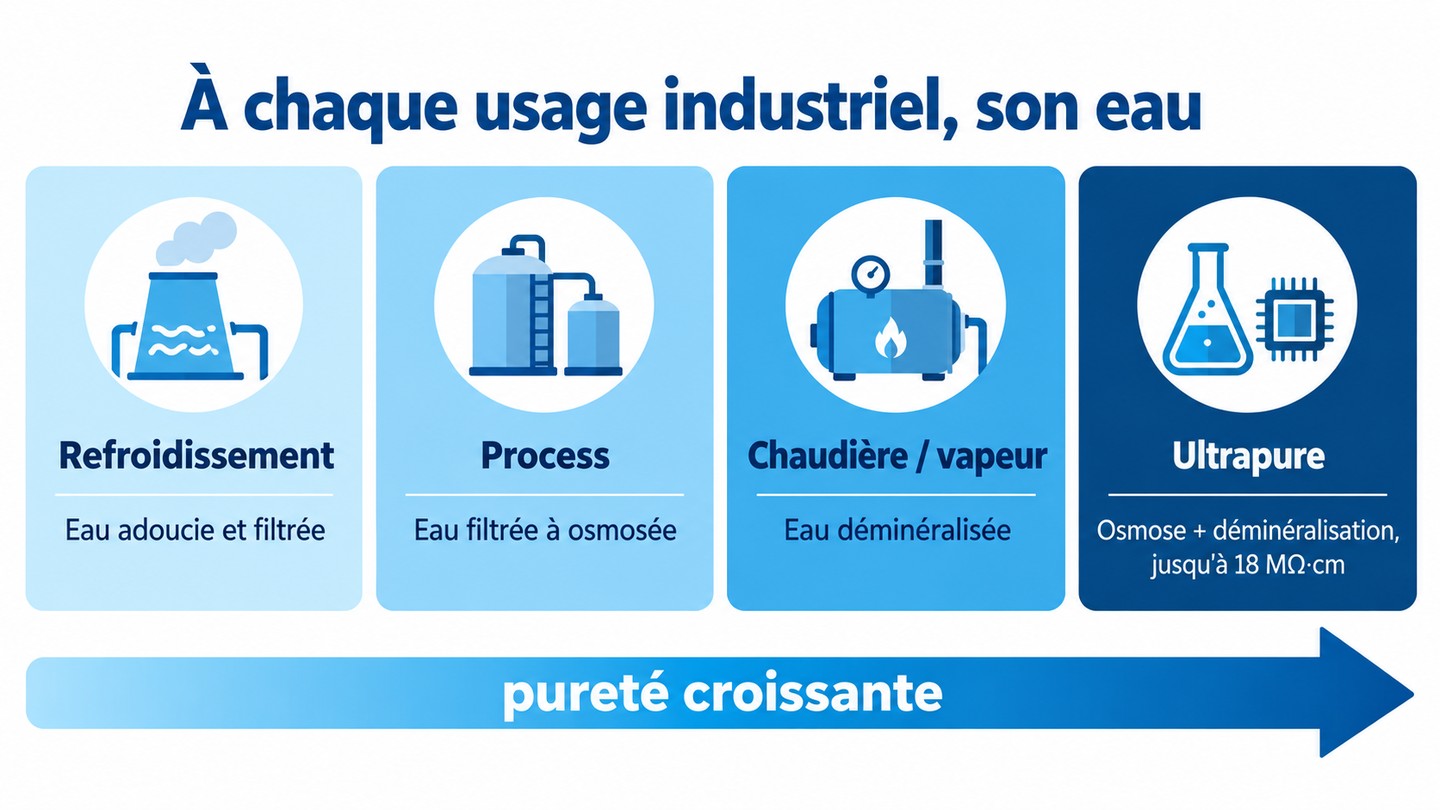
This is the heart of the matter: industry uses waters of very different qualities, produced by suitable treatments.
| Use | Required water quality | Typical treatment |
|---|---|---|
| Cooling water (cooling towers) | Softened, filtered, no scale or corrosion | Softening, filtration, conditioning |
| Process water (incorporated in the product) | From potable to RO depending on the product | Filtration, activated carbon, reverse osmosis |
| Boiler water (steam) | Demineralised (very low hardness and conductivity) | Softening + osmosis + demineralisation |
| Ultrapure water (pharma, electronics, lab) | Extremely pure (up to ≈ 18 MΩ·cm) | Osmosis + EDI + UV + polishing |
| Rinsing / CIP (food) | No hardness, no marks | Softening, osmosis, UV |
| Drinking / sanitary water | Compliant with drinking water | Filtration, UV, disinfection |
The principle: the more demanding the use (steam, ultrapure), the more the chain removes dissolved salts and impurities. Water too pure for a given use costs needlessly; water not treated enough damages the equipment. The whole point is the right level.
7. A closer look at the treatments
To go from raw water to the desired quality, treatment stages are stacked:
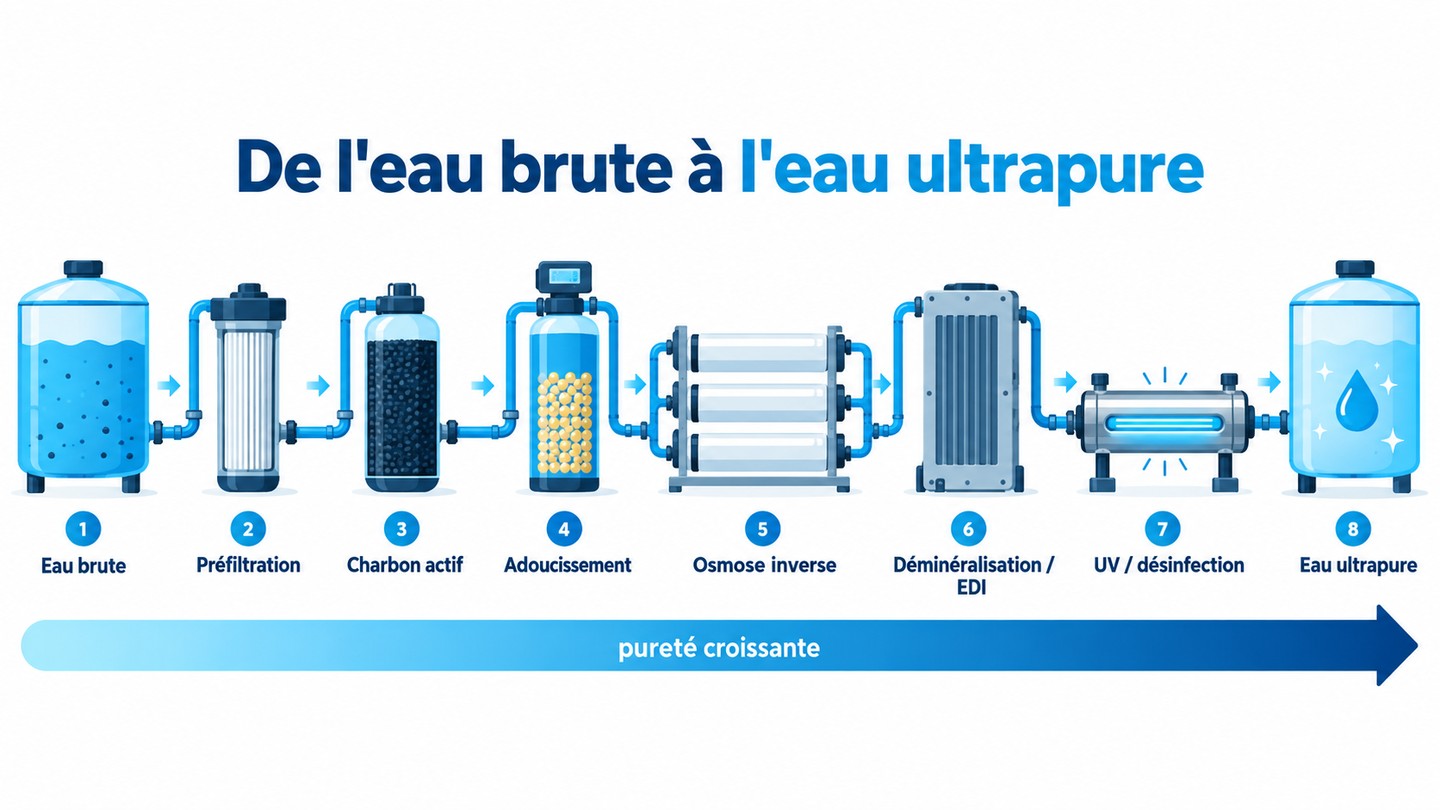
- Pre-filtration: retains sand and particles.
- Activated carbon: removes chlorine, tastes and organic matter.
- Softening: removes hardness (protects boilers and membranes).
- Reverse osmosis: removes most dissolved salts (demineralised water).
- EDI / final demineralisation: pushes purity up to ultrapure.
- UV / disinfection: secures microbiological quality.
Not every stage goes everywhere: the chain is sized according to the use, the flow and the source water.
8. The trend: reuse and loop
The fall in industrial withdrawals is no accident: it is the result of a strategy. Manufacturers recycle their water massively, notably via closed-loop cooling circuits, and reuse treated water for compatible uses.
Under the pressure of water stress and stricter regulations, this logic intensifies: reuse (water reuse), even zero liquid discharge (ZLD) in the most advanced cases. Water becomes a resource you keep circulating rather than consume, a challenge that is both economic and environmental.
9. What DIMM brings to manufacturers
DIMM designs and sizes treatment chains for each use: industrial reverse osmosis, softening, filtration and activated carbon, UV disinfection, up to ultrapure-water configurations. The goal: the right water quality, at the right flow, at the best operating cost, in Belgium, France and the Netherlands.
Conclusion
Belgian and French industry consumes water first to cool, and less and less in volume, thanks to recycling and closed loops. But the essential is quality: each use, from cooling to ultrapure water, requires a precise water, produced by the right treatment chain. Framing the equation which use, which quality, which flow well means making production reliable while controlling water consumption.
DIMM's teams support partner installers, distributors and resellers in Belgium, France and the Netherlands in choosing and sizing water-treatment solutions.
DIMM products & solutions
To produce the right industrial water, use by use:
- Industrial reverse osmosis (process, demineralised, ultrapure water)
- Filtration & activated carbon · UV disinfection
- The full DIMM product range
Key points & references
- France, 2023 freshwater withdrawals (excl. hydroelectricity): ≈ 29.4 billion m³. Breakdown: power-plant cooling ≈ 45%, navigation canals ≈ 20%, drinking water ≈ 18%, agriculture ≈ 10%, other economic activities (industry) ≈ 7%. Source: SDES / Ministry for Ecological Transition.
- France: since the mid-2000s, withdrawals for industrial uses have dropped by about 33%, and those for power-plant cooling by about 27%.
- Belgium / Wallonia: energy (cooling) ≈ 67% of withdrawals (2016-2020), drinking water ≈ 22%, industry ≈ 10%. Source: Walloon state of the environment.
- Wallonia: industry withdrawals fell by about 60% in ten years, notably via steel-industry restructuring and closed-loop water circuits.
- Industrial water types: cooling (softened water), process (potable to RO), boiler (demineralised), ultrapure (osmosis + EDI + UV, up to ≈ 18 MΩ·cm), rinsing/CIP (RO), drinking/sanitary.
- Country ranking by total freshwater withdrawal (World Bank / FAO AQUASTAT, 2020 data): India leads (≈ 647 km³/yr), China (≈ 568) and the United States (≈ 444); France is around 29th (≈ 26 km³/yr) and Belgium around 67th (≈ 4.2 km³/yr).
- Global comparison: the planet withdraws about 4,000 billion m³ of freshwater per year; global breakdown ≈ 70% agriculture, 15 to 20% industry, 12 to 13% domestic uses (FAO AQUASTAT). Industrialised countries devote a higher share to industry and energy than the global average.
- Trend: recycling, closed cooling loops, reuse and zero liquid discharge (ZLD) under water-stress pressure. Information dated September 2026.